")
Climate & Pollution
The role of weather on fine particulate matter (PM2.5) pollution
Weather and meteorological conditions govern the concentration of fine particle pollution. Wind speed, wind direction and temperature inversions are the most important components. Of course we have the orography, the morphology of the agglomeration that plays a major role but on more local areas (we speak at the scale of a street for example). Hence Pollutrack is very interested in weather forecasts to better predict periods of pollution.
Anti-cyclonic and depressive episodes
We know that winter anti-cyclonic periods cause temperature inversions and promote periods of pollution. Pollutants, fine particles from industry, heating and circulation remain trapped at the surface at ground level. It is therefore necessary to wait for a weakening, a shift in these high pressures and the return of a more disturbed (windy) weather to return to a lower level of pollution. The rain will wash away the air mass on the surface, allowing a sharp drop in pollution in a matter of hours. The direction of the wind has a more local and sometimes more global impact depending on the position of the action centers (anticyclone and depression) we can have pollution from distant sources (several hundred kilometers).
Temperature inversion?
Temperature inversion occurs under very specific weather conditions. It should also be noted that there are several types of temperature inversion. For example, we have year-round inversions of early morning temperatures, which are much less significant in summer than in winter, owing to sunlight. This type of inversion is called "night inversion". This is why we have a peak of pollution in the early morning under calm conditions. It is close to 6am in the morning in summer and 9am in winter. The soil cools more quickly by radiation.
The favorable conditions for having a temperature inversion are:
- The length of the night (no more heat loss on the surface),
- Clear skies,
- Dry air at the surface/or fog formation at the end of the night,
- Little or no airflow (no mixing),
- Snow cover results from maximum heat loss (increased night-time radiation) and greater temperature decrease.
A second temperature inversion better known to meteorologists as "subsidence inversion" is very different from the nocturnal inversion. We have a powerful winter anticyclone carrying air of subtropical origin with a relative softness at altitude. Of course, we must have in parallel an absence of surface wind but also no horizontal movement to see the formation of the temperature inversion.
This cooling can lead to the formation of low clouds or fog if the dew point is reached. Low clouds and fogs that can freeze if the temperature is below 0°C maintain temperature inversion (bell effect). In the mountains this is different because it is the relief that acts as a barrier that protects the valleys from possible turbulence at altitude.
The parameters that can stop the temperature reversal are a shift of the anticyclone (attenuation) with the rise of a surface flux causing air mixing and dissipating possible fogs or low clouds. The arrival of a forehead can also cause air mixing at altitude and then at the surface to stop the temperature reversal.
Other types of inversion exist such as "frontal inversion", "advection inversion" and "terrain inversion".
In addition to the pollution trapped under this "bell" combined with the humidity, we have the formation of a "smog" causing significant damage to health. Consider London’s smog of December 5, 1952, which killed 12,000 people.
Explanatory diagram for temperature inversion
(inversion of subsidence)
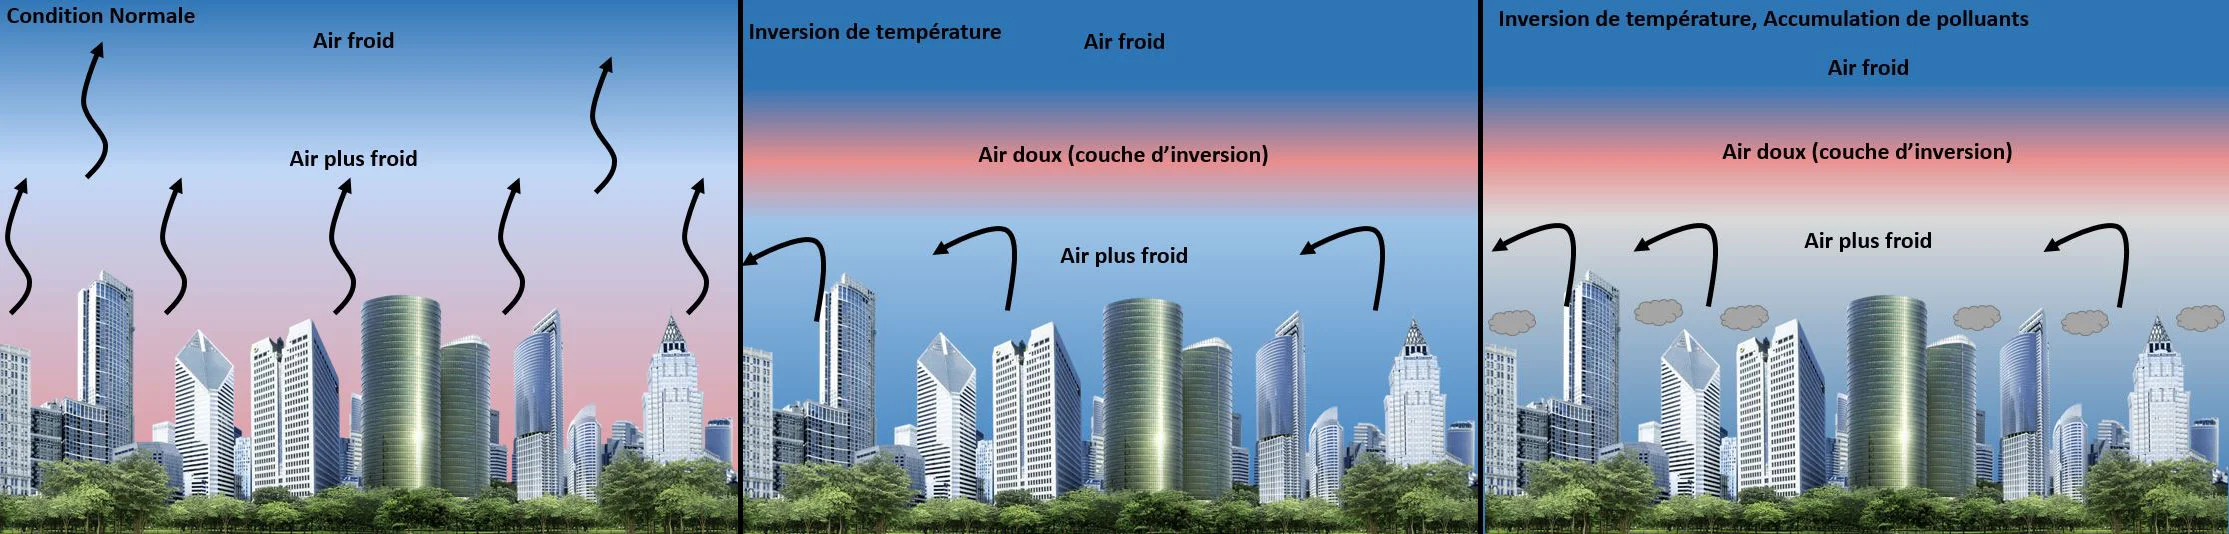 (Diagrams by Surcin Jérémy, Pollutrack)
More technical explanation with two examples,
that of 16 september 2012 and that of 18 january 2022
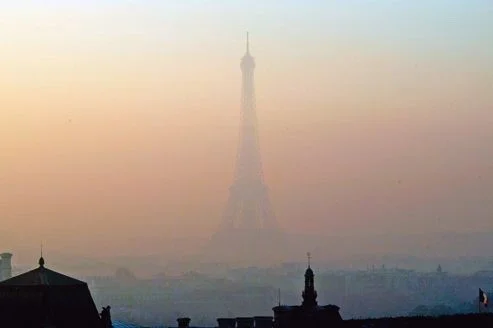 (photo by François BOUCHON/Le Figaro)
Weather situation on 16 September 201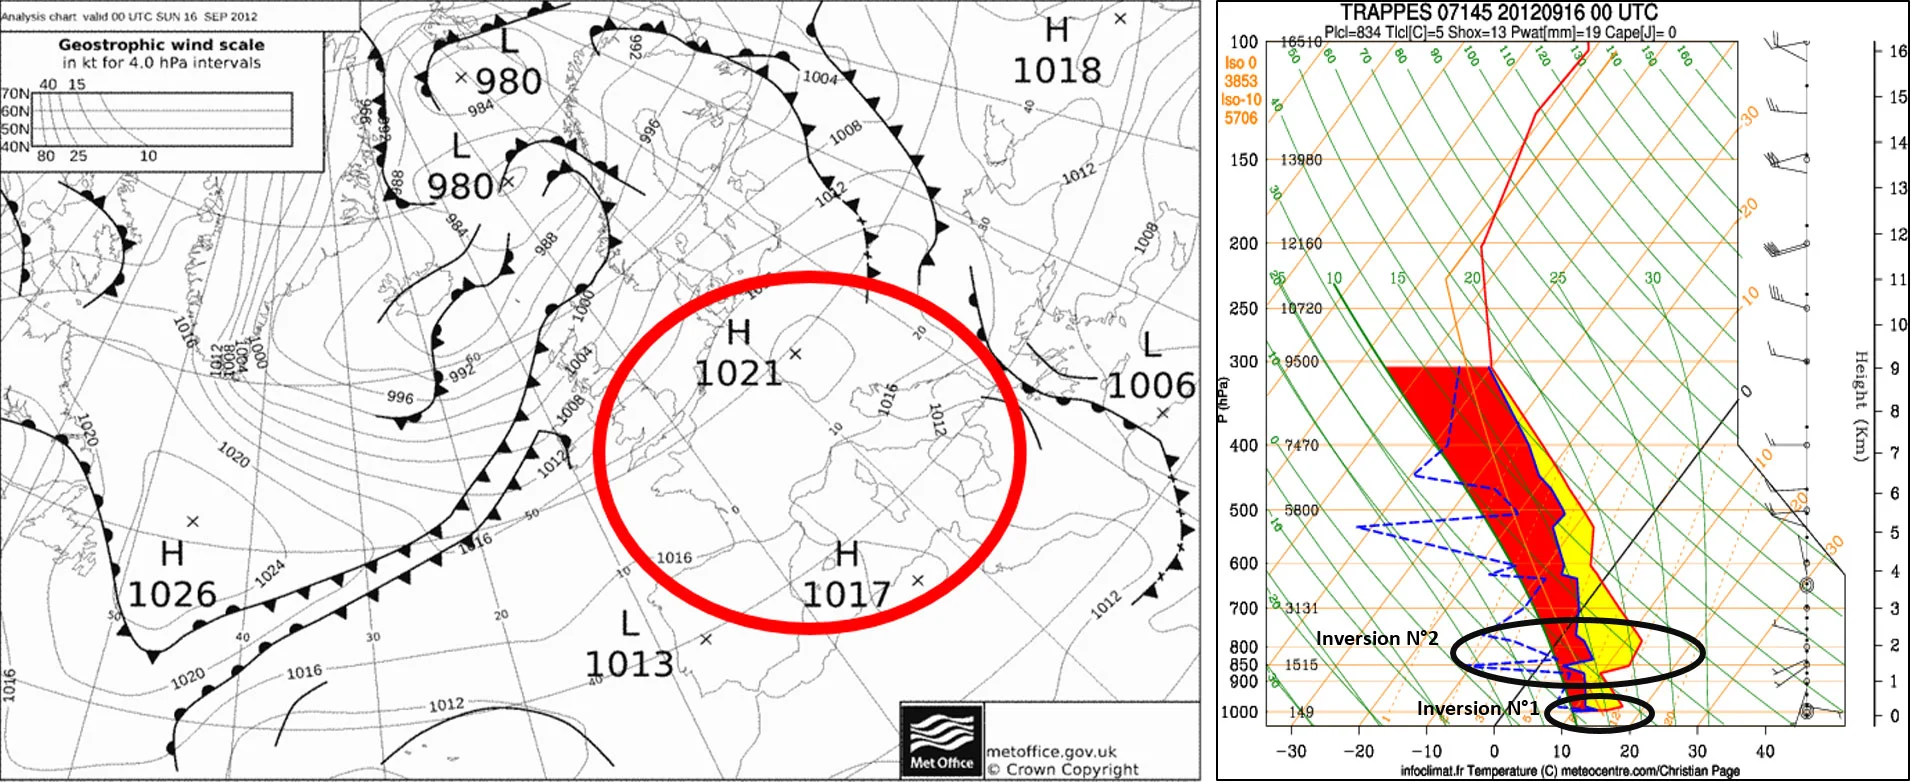 (Map of the meteorological situation in Europe on 16 September 2012 at 0am, by metoffice)
We have two temperature inversions. The first closest to the ground is night reversal, where the ground cools faster and forms a cold air layer. Here we have 14°C on the ground and 17°C at 300-350 m. The air is humid and saturated on the ground. It is this temperature inversion that is responsible for periods or peaks of pollution. It acts as a shield that traps all the particles on the ground. This boundary layer varies according to the season.
The second reversal is due to the weather situation of 16 September. The air mass cools as it rises and heats. The temperature is increased from 15° C. to 1500 m at 17° C. to 1450 m (850 hPa). The air is very dry. Signature of an adiabatic compression subsidence (anticyclonic situation). This temperature is indeed found on the Geopot 850hPa map above.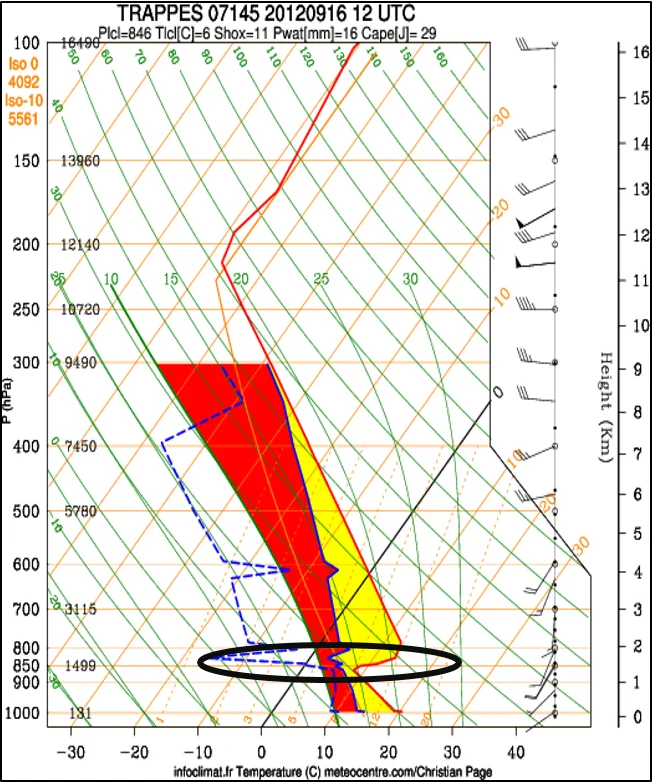 (Geopotential map and temperature at 850 hPa (1450 m))
At noon the diurnal reversal disappeared the soils are heated by the sun. The air is dry again on the ground with little wind, so pollution is always present.
We still have our temperature inversion at 850 hpa with very dry air. So we find ourselves in our anticyclonic situation.
Meteorological situation of 18 January 2022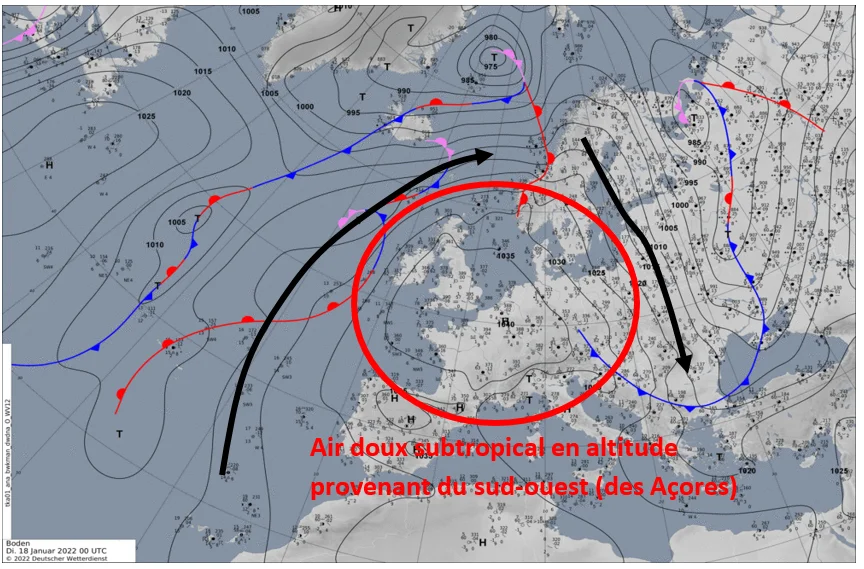
(Map of the meteorological situation in Europe on 18 January 2022 at 0am, by wetterzentrale)
A very strongly anticyclonic situation with a pressure of 1040 hPa. No surface wind with many fogs (satellite image below). Provision of subtropical soft air at altitude with a temperature above 850 hPa and much lower on the ground.
The 18 January 2022 at 0h de Trappe’s chart shows this temperature inversion with the formation of mists on the ground with saturation (cold and humid air mass).
While at altitude we find our softer subtropical air in a drier mass of air.
The average fine particulate matter concentration PM2.5 in Paris on that day of January 18, 2022 was 26 µg/m3.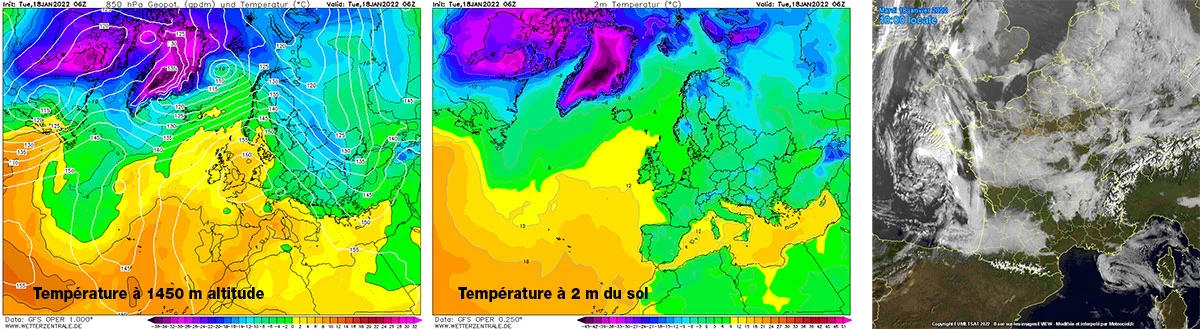
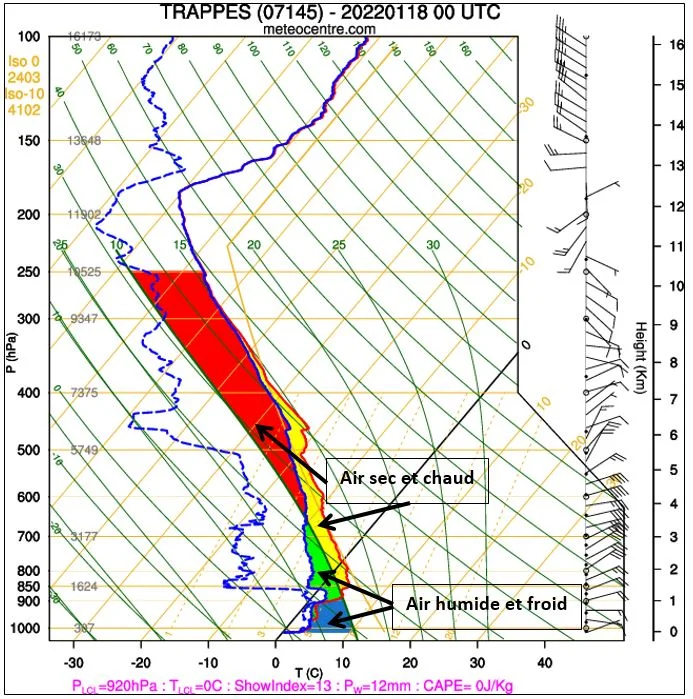
(Source: Émagramme du 18 January 2022 à 0h à Trappe, https://meteocentre.com)
Ground temperature at 0.00 h 0.3° C. We have 3.2° C. at 956 hPa (500 m). Then a bass from 951 hPa (540m) a decrease.
Cold air layer on the ground from 500 meters to midnight.
Low wind less than 5 knots (10 km/h).
Pollution trends in Paris on 18 January 2022 (anticyclonic situation)
(26 µg/m3)
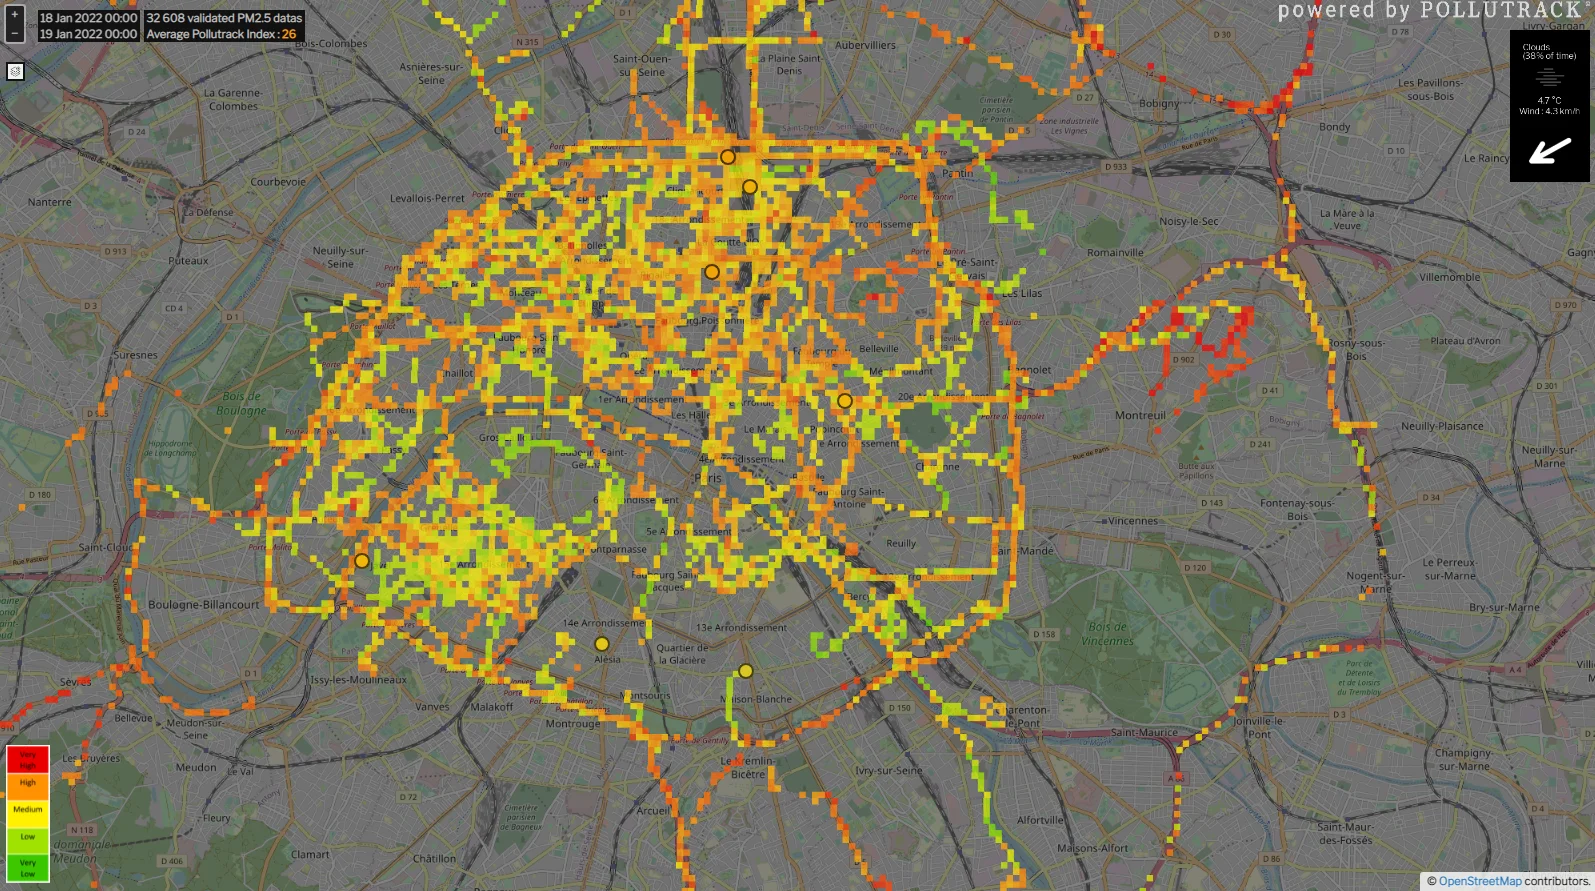
(Pollutrack mobile fleet data source)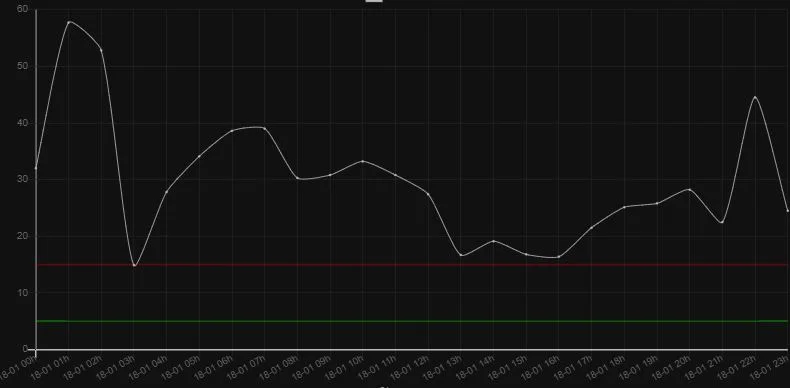
(Pollutrack mobile fleet data source)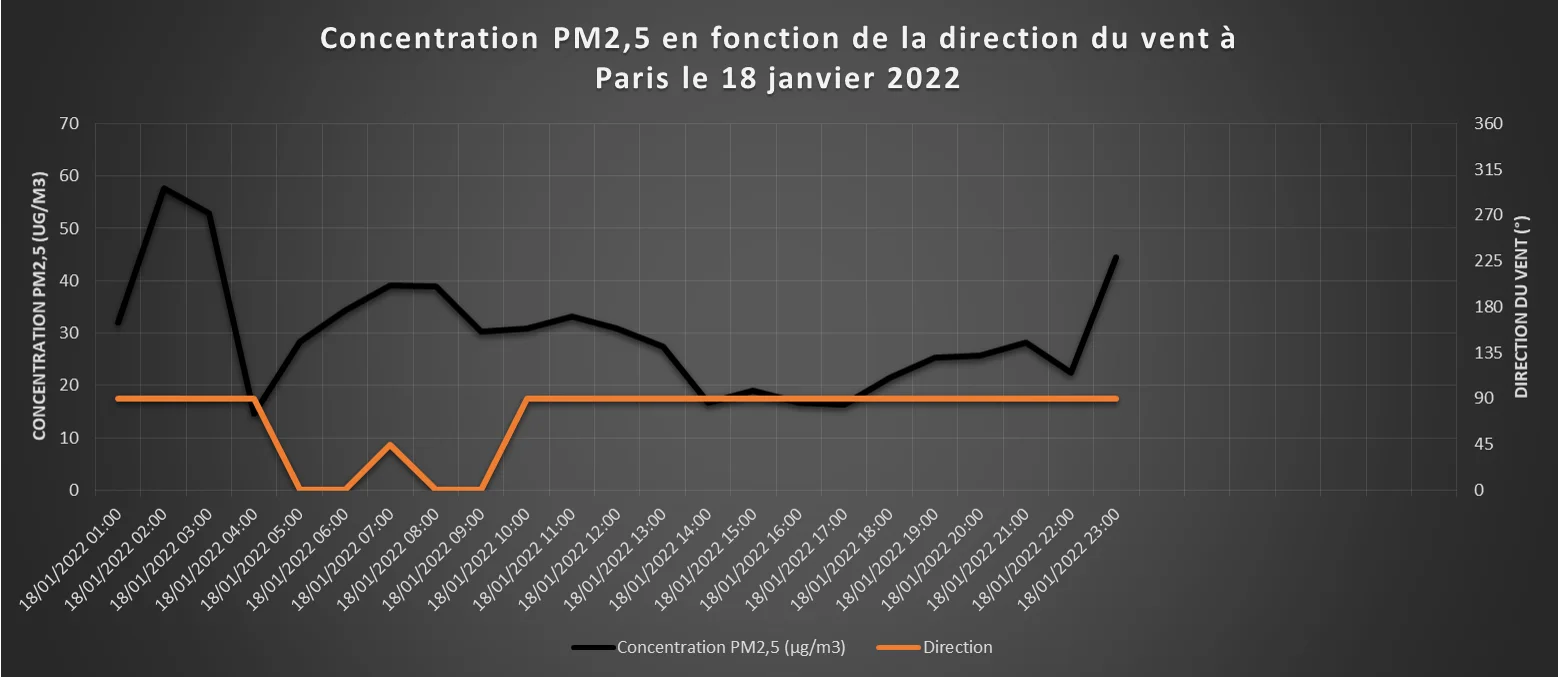
(Source, data from the mobile fleet Pollutrack, Surcin Jérémy)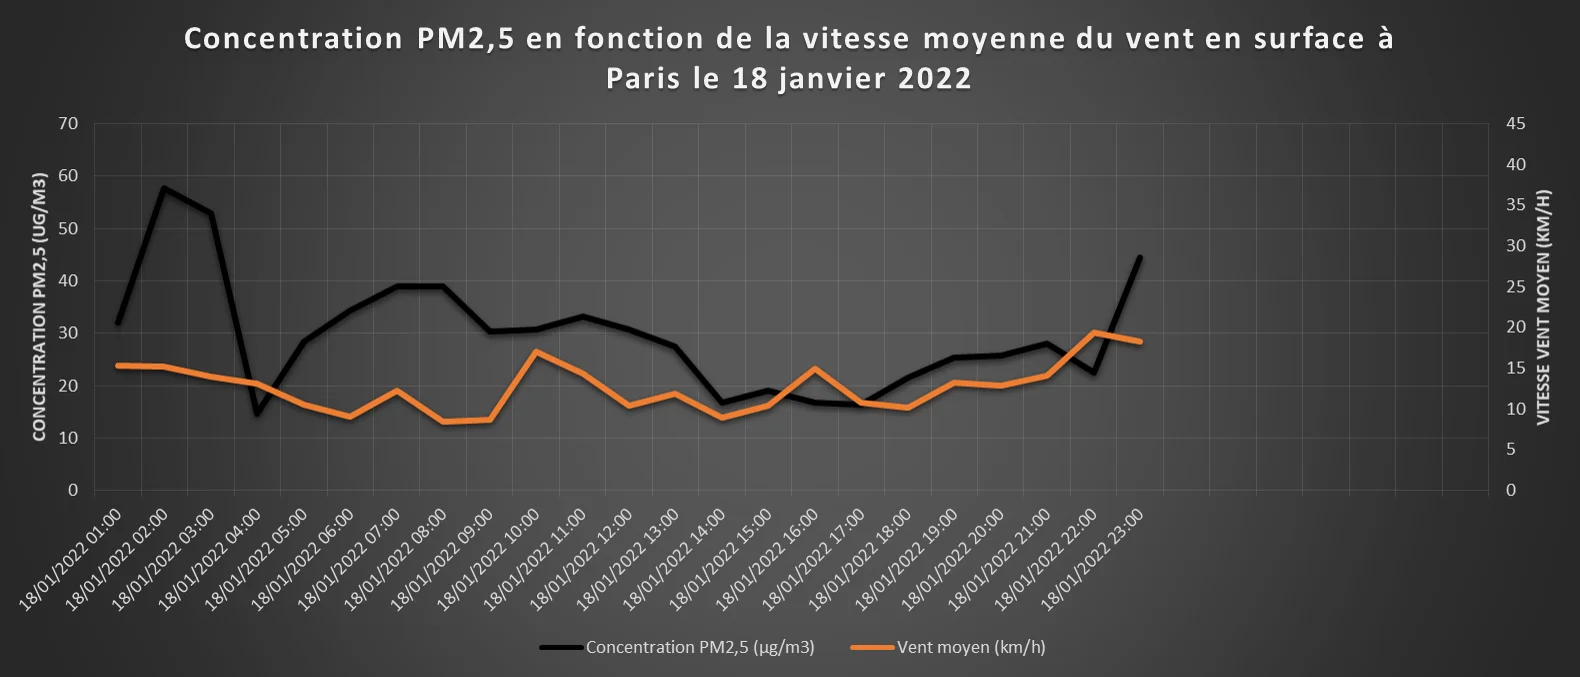
(Source, data from the mobile fleet Pollutrack, Surcin Jérémy)
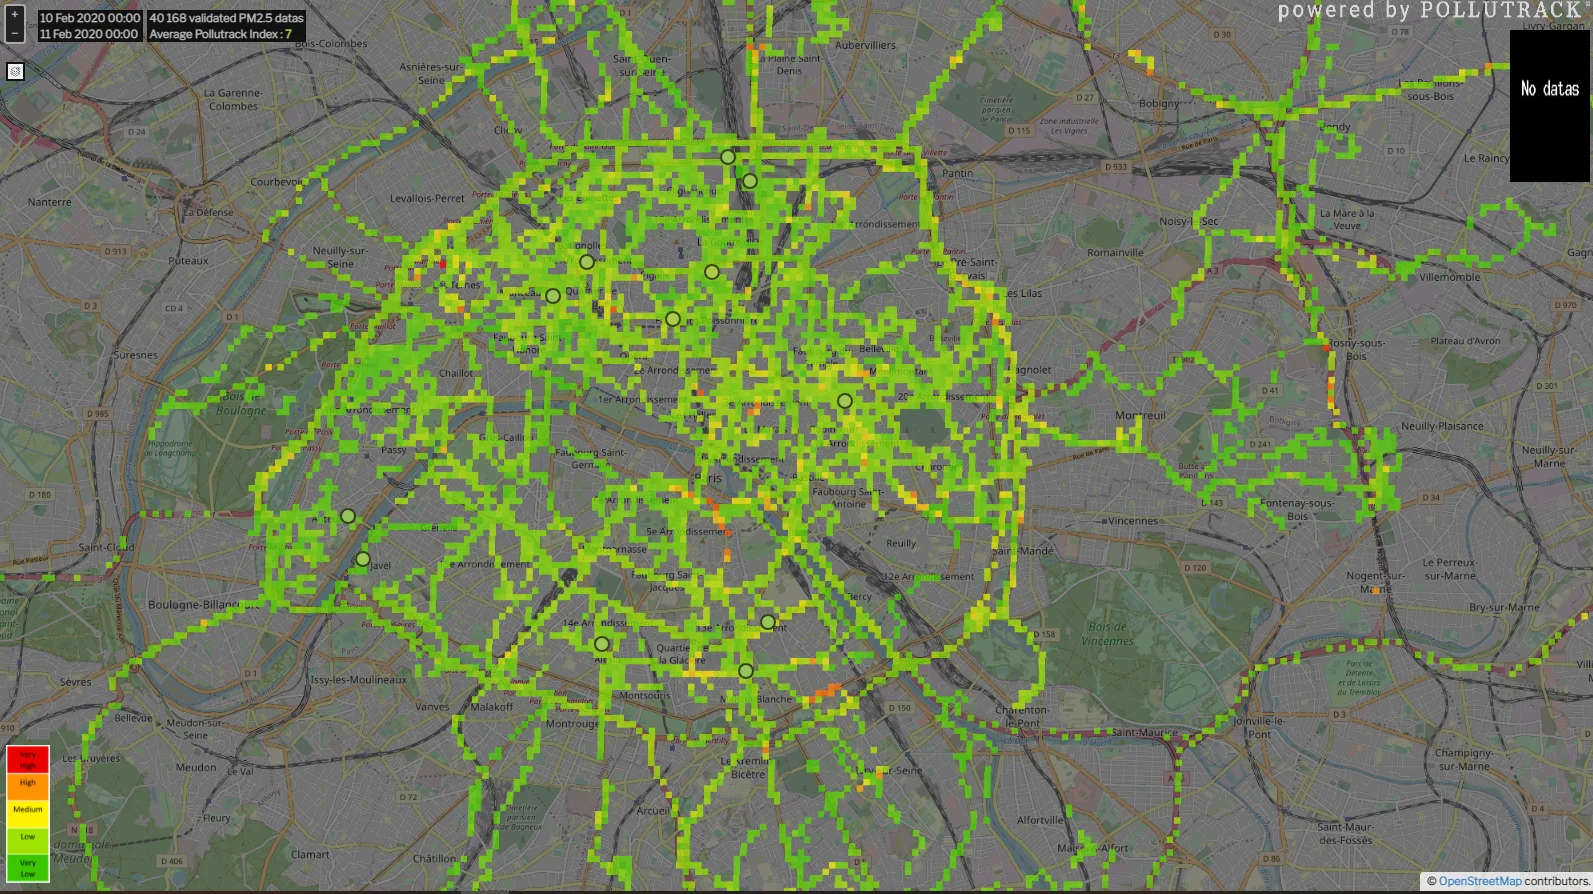
Pollution trends in Paris on 10 February 2020 (depressive condition)
(7 µg/m3)
(Pollutrack mobile fleet data source)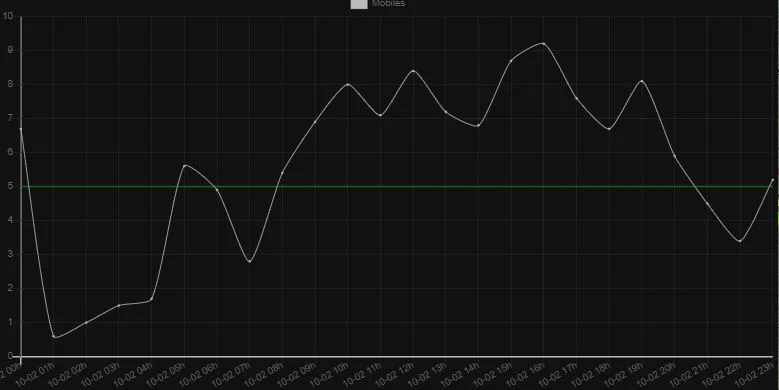
(Pollutrack mobile fleet data source)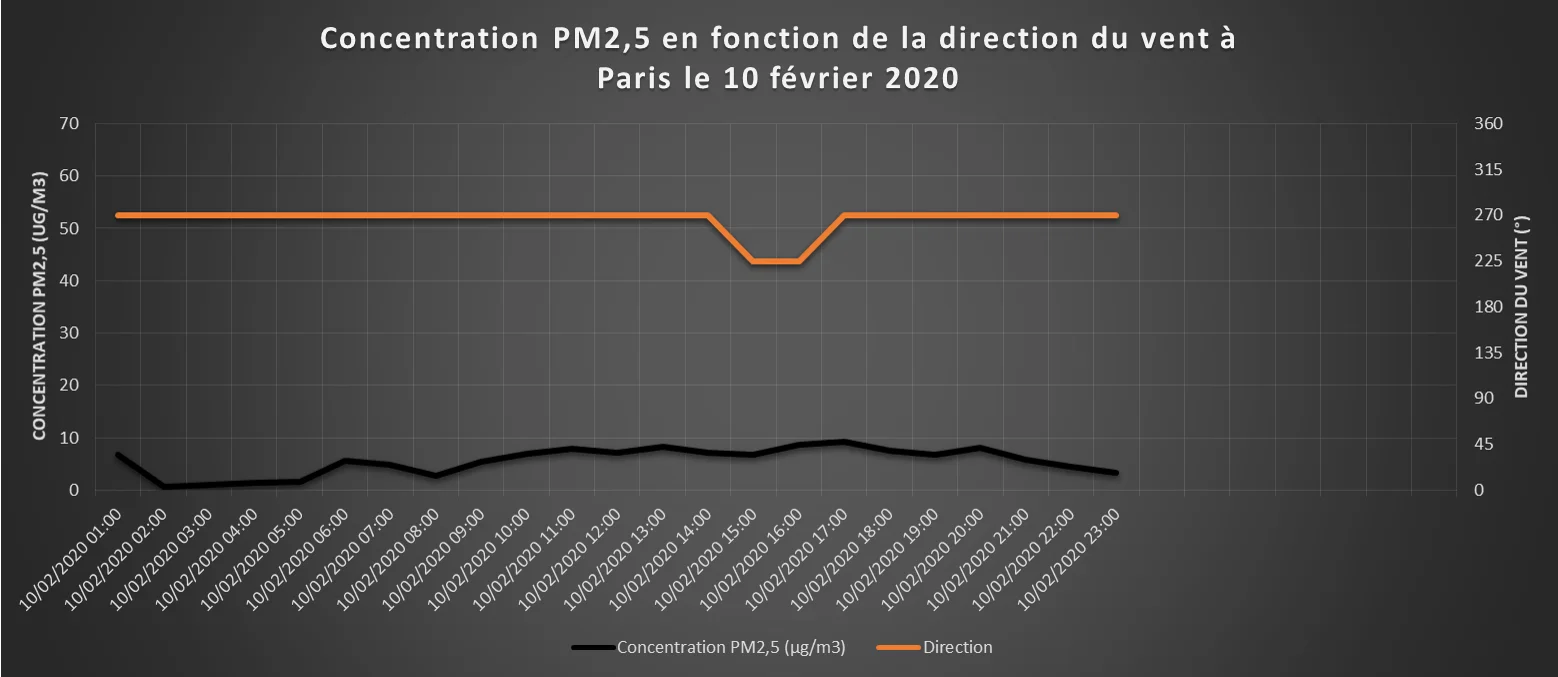
(Source, data from the mobile fleet Pollutrack, Surcin Jérémy)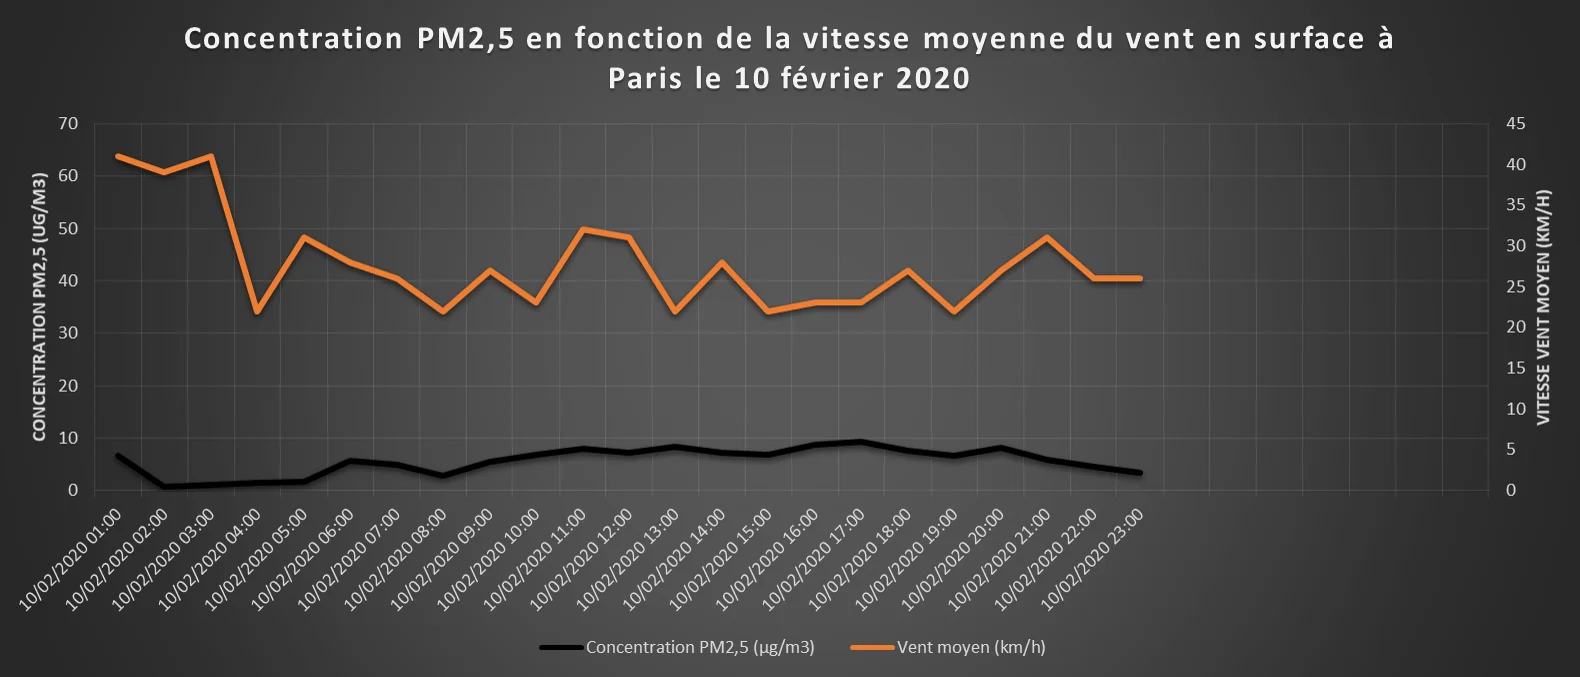
(Source, data from the mobile fleet Pollutrack, Surcin Jérémy)